
Analyze stacktrace In Android Studio | Debugging Tips & Tricks
In this video, you will learn how you can Analyze Stacktrace In Android Studio.
Visit my website: https://danishamjad.com/
Article Link: https://heartbeat.fritz.ai/tips-tricks-for-debugging-in-android-studio-c36a96173d7b
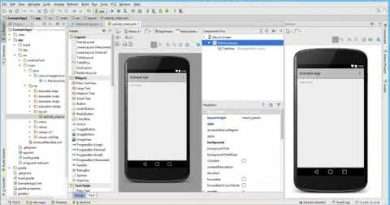
If you ever get a bug report that has a call stack in it, just copy that stack, head over to you Android Studio project and follow this flow:
Analyze tab → Analyze Stack Trace or Thread Dump → paste the stack there.
After this, you’ll see that the Android Studio console stack is fully annotated—this means you can click those annotated/highlighted classes that are causing the bug and quickly jump to your codebase with the exact line number.
Follow me:
* https://medium.com/@DaniAmjad
* https://twitter.com/DanishAmjad10
* https://github.com/DanishAmjad12
#AndroidDebuggingTips #android #stacktrace
Views :1997
android studio